
VIRAL HEPATITIS
HBV and HCV are major causes of viral hepatitis that lead to the development of cirrhosis and HCC. HBV gains entry into liver cells through a receptor mediated pathway. HBV-DNA integration into host genetic machinery causing DNA methylation resulting in oxidative stress and formation of HBx protein(1). The risk of developing HCC has been shown to be proportional to HBV-DNA level in liver cells. Chronic illness results from persistence of the virus in the host cells via various mechanisms that include infection of immune defense control centers, viral inhibition of antigen presentation,selective immune suppression, down-regulation of viral gene expression, and viral mutations that functionally incapacitate virus-specific T cells from recognizing HBV antigen(2)
HCV hijacks host cellular machinery to increase cellular proliferation, steatosis, inflammatory processes, mitochondrial dysfunction, insulin resistance, all leading to oxidative stress, genetic instability and DNA damage with cirrhosis and HCC as a likely outcome(3)
NON-VIRAL HEPATITIS
Diabetes mellitus, alcohol abuse, cardiovascular disease, liver inflammation, obesity, dyslipidemia and non-alcoholic fatty liver disease (NAFLD) are some other major contributors to HCC development(4)
Accumulation of iron in the liver of NASH and HCC patientsis correlated with progression of fibrosis and HCC. NAFLD provides the metabolic environment to induce insulin resistance a known etiological factor for HCC(4,5).
Obesity impairs metabolism, induces inflammation and is an etiological factor for NAFLD, steatosis, NASH, hepatic fibrosis, cirrhosis, and ultimately HCC.
Toxic by-products of alcohol catabolism such as accumulation of acetaldehyde and free radicals can influence oxidative stress, apoptotic cell death, necrosis and necroptosis(6).Reactive oxygen species (ROS) generation is the result of increased inflammatory cytokine. ROS-induced DNA damage, genomic vulnerability of hepatocytes and T-lymphocyte suppression contribute to HCC development. Alcohol diet have shown exacerbation of inflammation, epithelial-mesenchymal transition (EMT) andfibrosis, and consequent progression to HCC (3).
Other possible risk factors include genetic predisposition and congenital abnormalities, toxic exposures (aflatoxin or arsenic contaminated food), and autoimmune diseases of the liver. The pathogenesis of aflatoxin B1 (AFB1) – induced HCC includes several mechanisms, including the formation of mutagenic and carcinogenic intermediates and adducts. These adducts and intermediates can also directly induce a mutation at codon 249 of the p53 tumor suppressor gene. This replaces arginine with serine, a change that reverses the tumor suppressing ability of the gene. There are reports that suggest that AFB1 acts synergistically with HBV to induce HCC(7).
DIAGNOSIS OF HEPATOCELLULAR CARCINOMA
IMAGING MODALITIES
ULTRASOUND:
- Small focal HCC appears hypoechoic compared with normal liver.
- Larger lesions appear heterogeneous due to fibrosis, fatty change, necrosis and calcification.
- A peripheral hypoechoic halo may be seen with focal fatty sparing
- Contrast-enhanced ultrasound 1
o arterial phase-arterial enhancement from neovascularity
o portal venous phase
Decreased echogenicity relative to background liver ie wash out.
Tumour thrombus may be visible.(8)
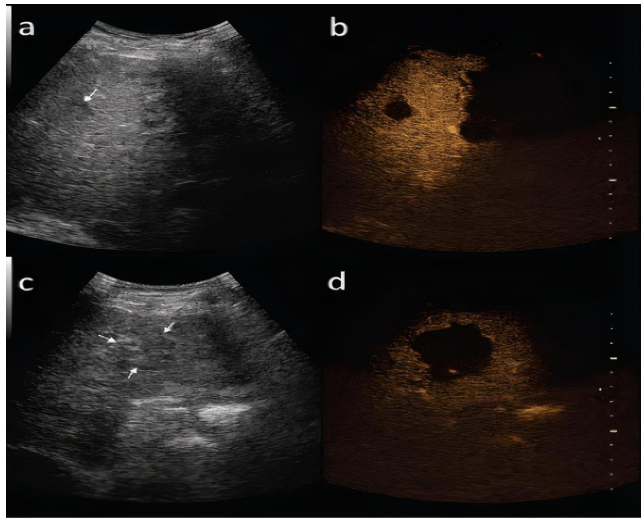
and in late phase of contrast-enhanced ultrasound (b,d)(9)
CONTRAST ENHANCED MULTIPHASE CT:
Imaging protocols are
- The patient was positioned in the supine position.
- Technical parameters were X-ray tube current 160 to 220 mA; tube voltage 120 kV;
collimation 5mm; rotation speed 0.75 s; matrix 512×512. Iohexol (350 g/L) was used to
perform the contrast-enhanced scanning.
- A high-pressure syringe was used to inject 1.2-2 ml/kg of contrast agent at injection rate
of 3.5- 4.0mL/s. Twenty millilitre saline were later injected at the same rate.
- Scanning range was set to from the lower chest to the to lower abdomen level.
- All image data were transmitted directly to our picture archiving and communication
system. Sagittal and coronal reformats of images were also obtained(10).
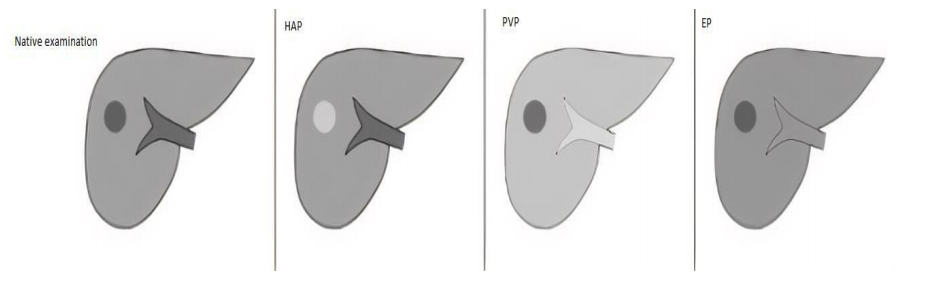
Imaging of FLLs in CT requires the use of a multi-phase study protocol.
- Includes a phase prior to the intravascular administration of contrast agent.
- Phases obtained after intravascular administration of contrast medium – Hepatic arterial
phase(HAP), Portal Venous Phase(PVP) and Equilibrium phases(EP) obtained routinely
40, 60 and 180 seconds post contrast administration respectively in a multi-row CT unit
- EP may be also referred to as an early delay phase in comparison to the late delay phase,
obtained after 10 to 15 minutes after administration of contrast medium, acquired if the
imaging protocol is extended to detect lesions with a high content of fibrous tissue(9).
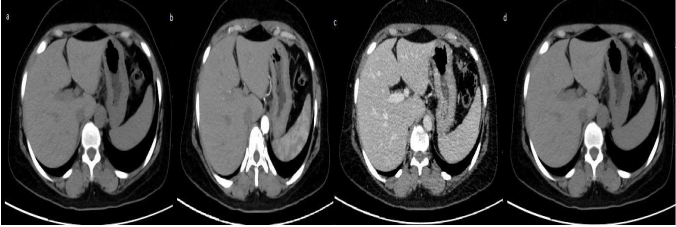
hepatic arteries and slight enhancement in portal vein (b), portal venous phase (c) equilibrium
phase (d).
Imaging features in Hepatocellular carcinoma
- HCCs enhance strongly in the HAP, depending on the size of the tumor and the presence
of regressive changes homo- or heterogeneously. Large tumors will typically present with
heterogeneous enhancement, often with so-called mosaic pattern as opposed to small,
early forms of hepatocelullar carcinomas
2. Washing-out of the contrast agent in PVP (the phase of the strongest enhancement of the
liver parenchyma) or/and EP is a sine qua non for diagnosing HCC with specificity of 95-
96%.
3. If tumor pseudo-capsule is present, it is more clearly visible in the PVP and EP than in
HAP, with delayed enhancement in EP. Tumors with pseudo-capsule show better
prognosis(11)
in HAP and wash-out of contrast agent in subsequent PVP and EP(12)
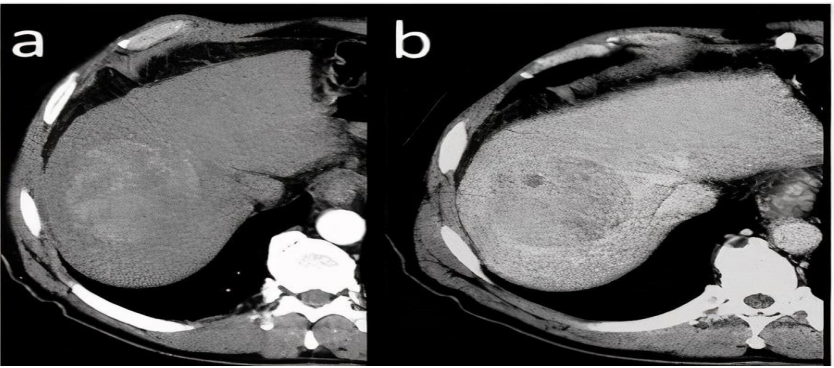
feature and enhancing tumor pseudo-capsule is visible in the latter(9).
DYNAMIC CONTRAST ENHANCED MAGNETIC RESONANCE IMAGING
Standard MRI protocol consists of
- Patients were positioned supine head first on the MRI table, then the MRI was
performed including T2 weighted fast spin-echo (T2-FSE) and DIXON, Duel echo
sequence(TE 90 and 180 ms), chemical shift imaging (in- and opposed-phase) and
diffusion-weighted image (DWI) map was performed for using b value of 500 (with
TR 1300 ms & TE 64 ms), with corresponding ADC mapping.
- CE-MRI was performed afterward using gadopentetate dimeglumine
(Omnivist)/gadoterate meglumine(Clariscan) injected through an antecubital
intravenous catheter at a rate of 1.2 ml/min over 15 s and a dose of 0.2 ml/kg followed
by saline chaser of 20 ml at a rate of 1–2 mL/s
- Dynamic contrast-enhanced sequences were acquired using DIXON sequence
acquired before (pre-contrast) and after contrast injection at 15-20 s (arterial phase), 40
s (portal phase), 60s (venous phase), and 180s (delayed phase). All contrast sequences
were acquired at the axial plane(13).
Imaging features in Hepatocellular carcinoma
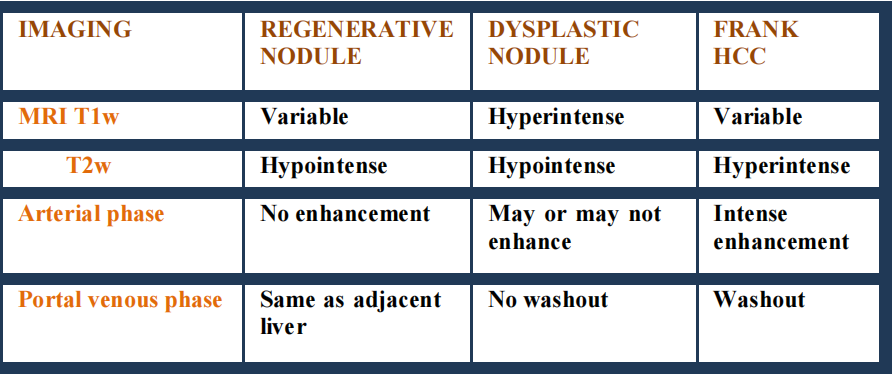
- Pre-contrast MRI sequences the majority of large HCCs show decreased signal intensity
in T1-weighted and increased signal intensity in T2-weighted images.
Small lesions tend to remain isointense to the adjacent liver parenchyma in T1-weighted
images Presence of intracellular fatty components may be easily confirmed in phase and
out of phase sequences.
- Decrease in signal intensity in T2-weighted images is seen in case of fibrous tissue,
while areas of necrosis present especially within large foci cause an increase in signal
intensity and lead to heterogenous enhancement.
- Low signal intensity of regenerative nodules in T2-weighted images resulting from
characteristic iron deposits, facilitate differential diagnosis with usually hyperintense
HCC foci.
- Pseudocapsule is hypointense in T2-weighted images and shows delayed enhancement
in EP, similarly to CT.
- DCE-MRI shows a similar enhancement pattern in majority of HCCs as observed in
multiphase CT with early strong enhancement in HAP and washing-out in the following
phases.
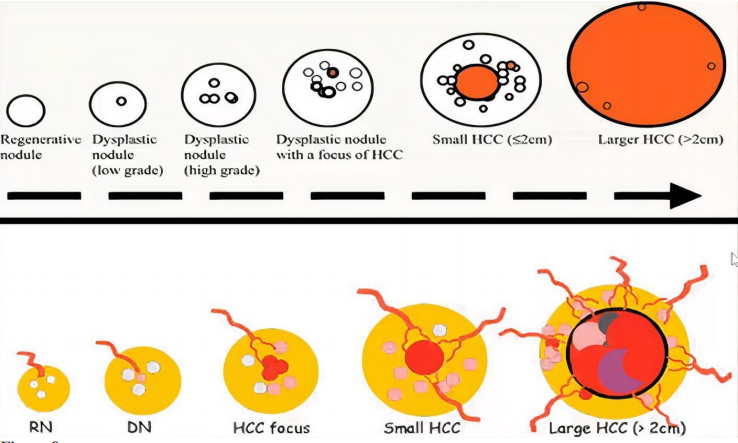
Stepwise carcinogenesis of HCC in cirrhosis
- Early washout can be seen in high grade or undifferentiated hepatocellular carcinoma
since the lesion is entirely supplied by hepatic artery. So the phase of washout will
help in diffentiation the grade of hepatocellular carcinoma.
- Hepatocellular carcinomas have fat within it where as dysplastic and regenerative
nodules do not contain fat within it.
- HCC directly invades the vessel and enhances on arterial phase.
- Collateral formation and prominent adjacent vessel are the additional imaging features seen in HCC.
- Intratumoural psuedoaneurysms are common in HCC(9).
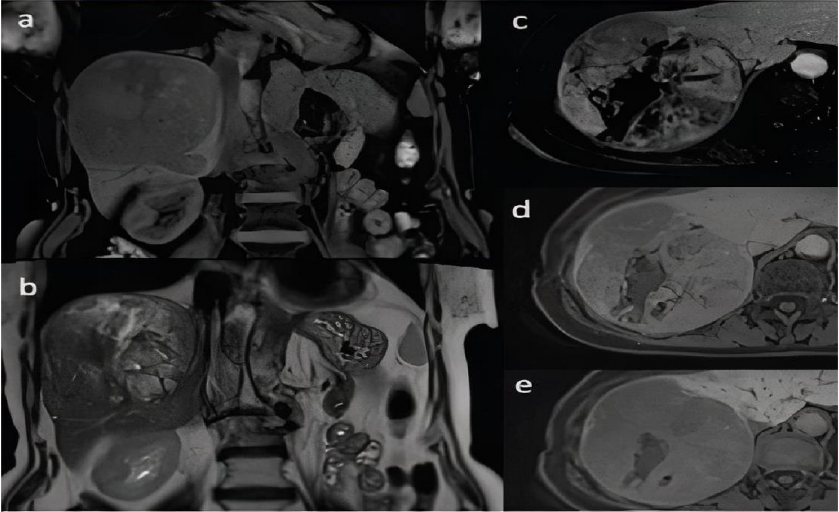
(a) and in coronal T2-weighted image (b). Dynamic contrast-enhanced sequences in axial T1-
weighted images with fat saturation after administration of hepatocyte-specific contrast agent in
hepatic arterial phase (c), portal venous phase (d) and hepatobiliary phase (e). Heterogenous
enhancement of the lesion is seen with areas of non-enhancing focal necrosis (c) with subsequent
washing out of the contrast agent (d). Lesion shows low signal intensity in comparison to adjacent
liver parenchyma in hepatobiliary phase (e) (9).
OTHER PARAMETERS FOR DIAGNOSIS OF HCC
LABORTARY TESTS-Serum AFP is the most widely used tumor biomarker in
diagnosis of HCC. An increase of serum AFP levels in cirrhotic patients, however its
value is often considered insufficient(14)
HISTOPATHOLOGY- Well vascularized tumors with wide trabeculae (> 3 cells),
prominent acinar pattern, small cell changes, cytologic atypia, mitotic activity, vascular
invasion, absence of Kupffer cells and the loss of the reticulin network(12).